

Gold price (XAU/USD) remains under pressure in the early European trading session on Wednesday. The precious metal is struggling below the $4,150 level after falling close to the $4,100 area in the previous session.
GOLD TECHNICAL ANALYSIS
XAU/USD Gold Price Analysis: $4,280 Support & $5,400 Target
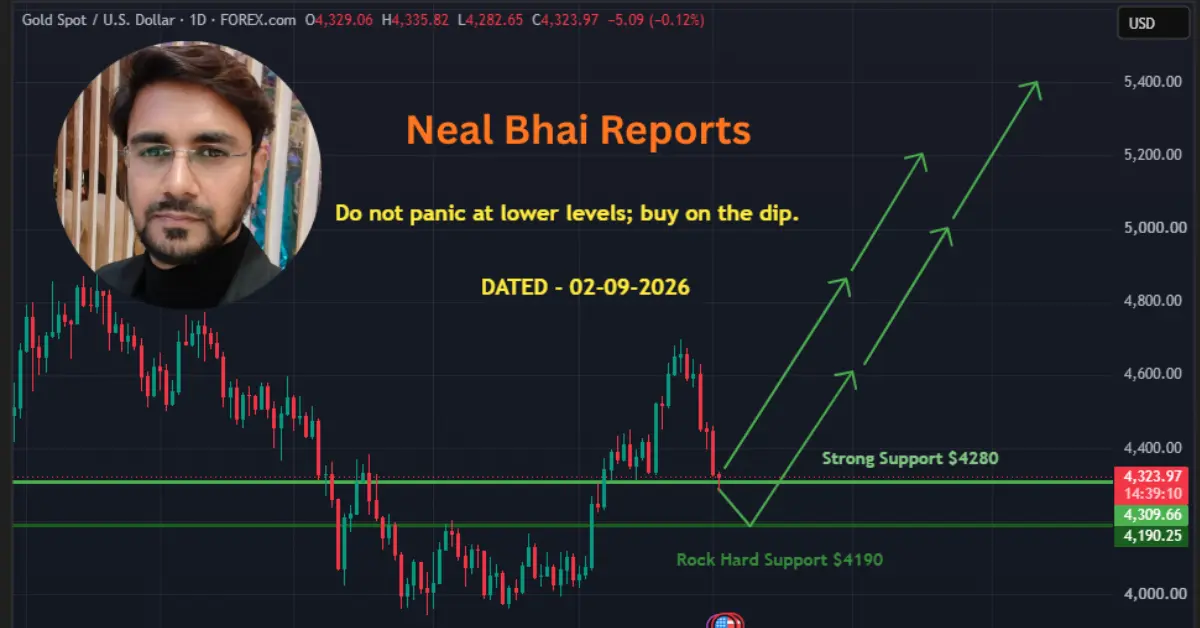
Gold (XAU/USD) is showing a bullish structure on the daily chart, even after the recent pullback from the $4,600–$4,700 zone. The chart dated September 2, 2026 shows gold trading around $4,323.97, with an important support area near $4,280.
Gold Holds Firm as Fed Minutes and Iran Risks Keep Markets Cautious

gold price outlook: Gold (XAU/USD) remains at elevated levels as lower Treasury yields and the US Treasury’s larger debt buyback plan provide support. However, the Federal Reserve’s concerns about persistent inflation could limit further gains. Geopolitical tensions involving Iran and uncertainty around the Strait of Hormuz also remain in focus. The technical structure stays positive after gold turned higher from the lower wedge support. Markets will now focus on Fed policy signals and geopolitical developments for the next direction.
MCX Gold Forecast: Bullish Momentum, Targets & Key Levels
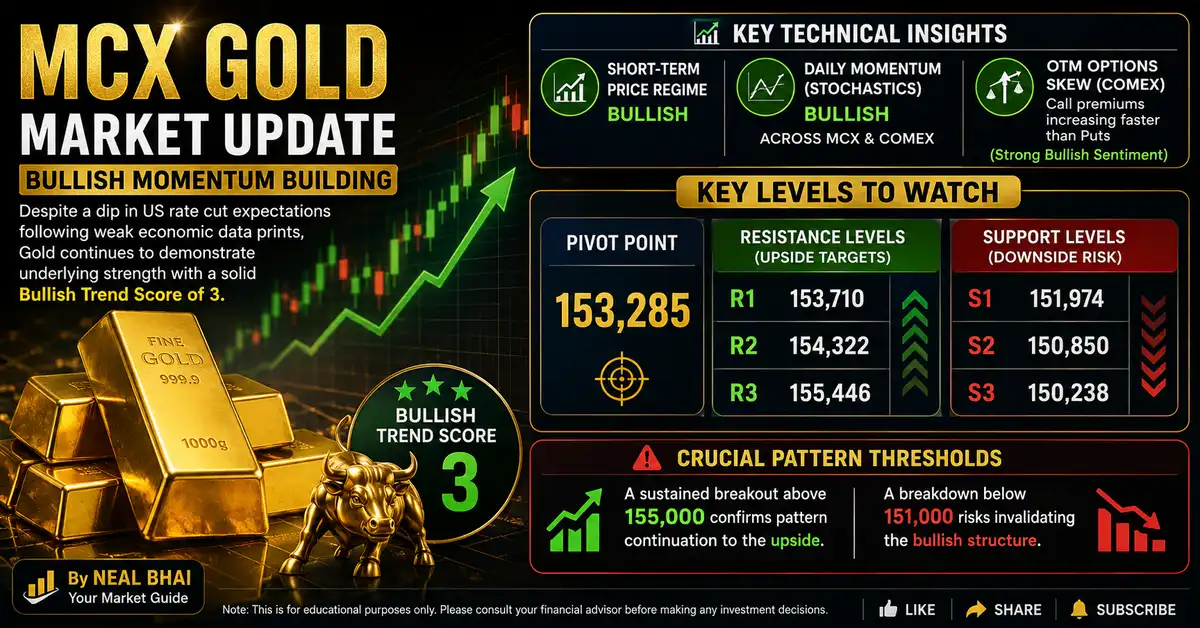
MCX Gold Forecast: MCX Gold is showing signs of renewed strength, with the short-term technical setup remaining positive. Even though expectations of US interest-rate cuts have weakened after recent economic data, gold is holding firmly and continues to attract buying interest.
Gold Price Forecast: Buy Above $4,750? Targets $5,000+ – Neal Bhai Analysis

Gold price forecast: Gold (XAU/USD) may turn bullish above $4,750, says Neal Bhai. Check key targets, strategy, and expert outlook for traders and investors.