
Gold Silver Reports (GSR ) – On the daily chart, the gain on Monday confirms a break above the former resistance at $1,238, the 14.6 percent projection level of a downward wave C from $1,366.07. The next Resistance will be at $1,305.
Spot Gold
At Gold Silver Reports, we provide real-time updates on Spot Gold (XAUUSD) with live prices, expert analysis, and daily trading insights. Stay ahead with accurate forecasts, support & resistance levels, and global gold market trends to guide your trading strategies.
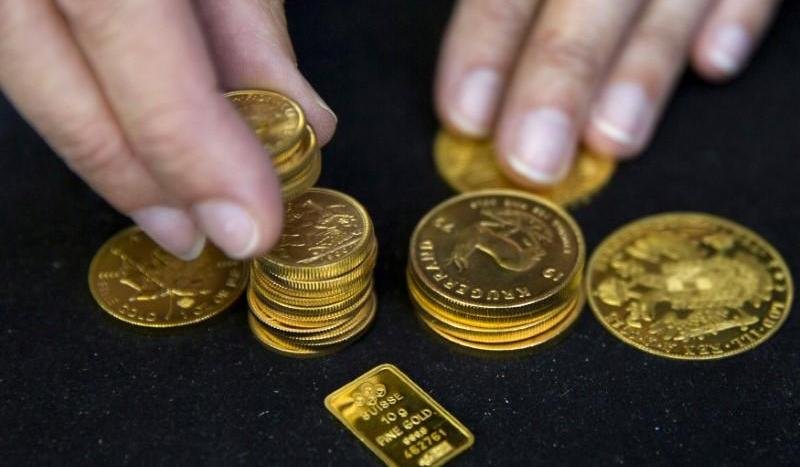
Spot Gold May Rise into a Range of $1258-$1266 per Ounce
Spot gold may rise into a trading zone of $1258—$1266 level per ounce, as it has broken a resistance at $1245, Technical Analyst Neal Bhai.
Global stocks extended their slump on worries over slowing growth and fears that a fresh flare-up in tensions between U.S. and China could quash chances of a trade deal.
Bullion Also Fell Below the 100 Day Moving Average
Gold Silver Reports (GSR) — Spot gold was down 0.8 percent at $1,213 per ounce at 13:34 p.m EDT (1734 GMT), having touched its lowest since Oct. 11 at $1,211.52. U.S. gold futures settled down $10.30, or 0.8 percent, at $1,215.
Spot Gold Weekly Technical Outlook – 29-Oct-2018
Technical Outlook – Technical Outlook: In our last Gold Weekly Technical Outlook, we continued to highlight a critical resistance confluence at $1238/1243, “a region defined by the 38.2% retracement of the yearly range, the 100% extension of the advance off the August low, the December swing low and the long 200-week moving average.” Price is testing this zone now and a weekly close above is needed to keep the immediate long-bias viable.
Spot Gold was up 0.2 percent at $1,203.86 – Neal Bhai Reports
Gold Silver Reports (GSR) — Spot Gold – “However, there is not much of a safe-haven appeal (for gold) as the market is not packing in a lot of punch to trade war.”