
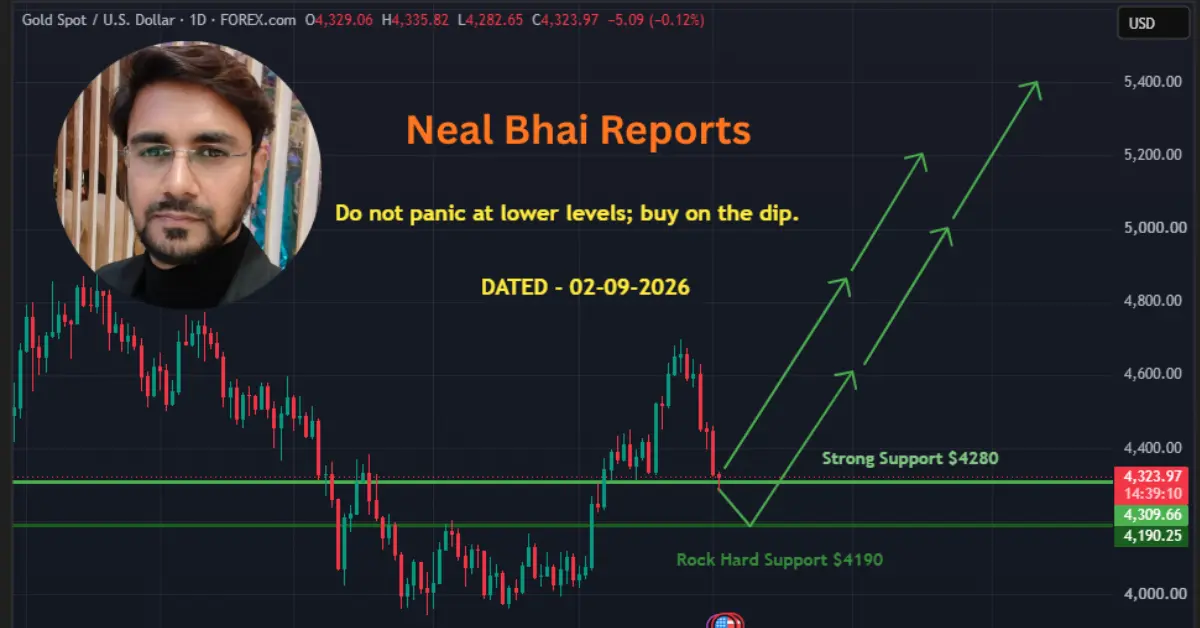
Gold (XAU/USD) is showing a bullish structure on the daily chart, even after the recent pullback from the $4,600–$4,700 zone. The chart dated September 2, 2026 shows gold trading around $4,323.97, with an important support area near $4,280.
- Gold Price Target $5,200: What Did Neal Bhai Say?
- Silver Demand: Data Centres Could Drive Electronics Demand
- Gold Holds Firm as Fed Minutes and Iran Risks Keep Markets Cautious
- Silver Demand: Data Centres Could Drive Electronics Demand
The overall setup remains positive as long as gold continues to respect the major support levels.
XAU/USD Technical Analysis
Gold recently moved sharply higher after spending several weeks in a consolidation phase. The latest correction has brought the price back towards an important support zone.
Key Support Levels
- $4,280 – Strong Support
- $4,190 – Major / Rock-Hard Support
The $4,280 level is the first important area to watch. If buyers defend this zone, gold may attempt another upward move.
The $4,190 level is the major support shown on the chart. A sustained move above this area keeps the broader bullish structure intact.
Upside Targets
If gold holds support and buying momentum returns, the chart indicates several potential upside levels:
| Target | Potential Move |
|---|---|
| $4,600 | First major upside zone |
| $4,800 | Next resistance/target |
| $5,000 | Important psychological level |
| $5,200 | Higher bullish target |
| $5,400 | Long-term chart target |
The chart suggests that a successful recovery from the support zone could gradually take XAU/USD towards $4,600, $4,800, $5,000, $5,200 and potentially $5,400.
Gold Trading Strategy
The current chart favours a buy-on-dips approach rather than panic selling at lower levels.
If gold stays above $4,280, buyers may try to regain the recent highs. A strong recovery above the recent resistance area could improve the chances of a move towards $4,800 and $5,000.
However, traders should watch $4,190 carefully. A decisive break and sustained close below this major support could weaken the current bullish setup and lead to a deeper correction.
Important Levels at a Glance
| Level | Importance | View |
|---|---|---|
| $5,400 | Long-term target | Bullish |
| $5,200 | Major upside target | Bullish |
| $5,000 | Psychological target | Bullish |
| $4,800 | Upside target | Bullish |
| $4,600 | Near-term target | Bullish |
| $4,280 | Strong support | Key level |
| $4,190 | Major support | Trend-defining level |
XAU/USD Outlook
The daily chart continues to favour the bulls while price remains above the $4,190 major support zone. The immediate focus is on whether gold can defend $4,280 and start another recovery.
Simple view:
👉 Above $4,280 = positive/bullish setup
👉 $4,190 = major support
👉 Recovery above recent highs = potential for higher targets
👉 Possible upside zones = $4,600 → $4,800 → $5,000 → $5,200 → $5,400
Do not panic at lower levels; buy on the dip only with proper risk management.
Frequently Asked Questions
1. What is the current XAU/USD price shown on the chart?
The chart shows XAU/USD trading around $4,323.97 on September 2, 2026.
2. What is the strongest support for XAU/USD?
The chart identifies $4,280 as strong support, while $4,190 is marked as a major or rock-hard support level.
3. What are the upside targets for gold?
The chart shows potential upside levels at $4,600, $4,800, $5,000, $5,200 and $5,400.
4. Is the XAU/USD trend bullish?
The daily chart has a bullish structure as long as gold continues to hold the major support area, particularly $4,190.
5. Should traders panic if gold falls towards support?
A fall towards support does not automatically mean the bullish trend is over. Traders should watch how price reacts around $4,280 and $4,190 and manage risk carefully.