

Gold price (XAU/USD) remains under pressure in the early European trading session on Wednesday. The precious metal is struggling below the $4,150 level after falling close to the $4,100 area in the previous session.
gold resistance
XAU/USD Gold Price Analysis: $4,280 Support & $5,400 Target
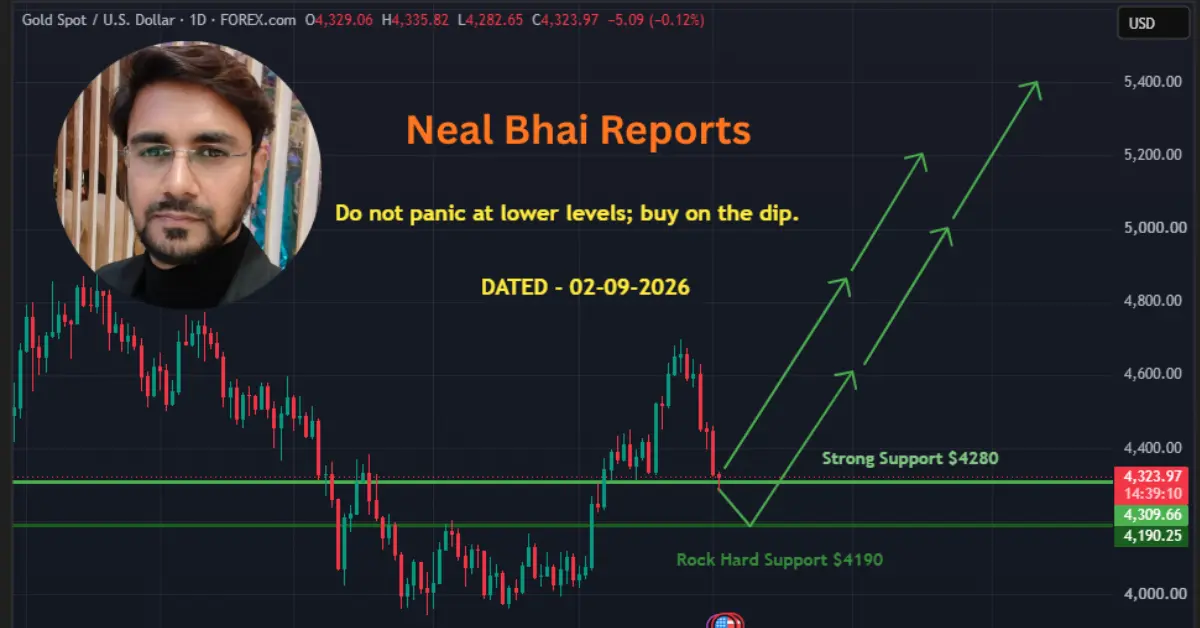
Gold (XAU/USD) is showing a bullish structure on the daily chart, even after the recent pullback from the $4,600–$4,700 zone. The chart dated September 2, 2026 shows gold trading around $4,323.97, with an important support area near $4,280.