
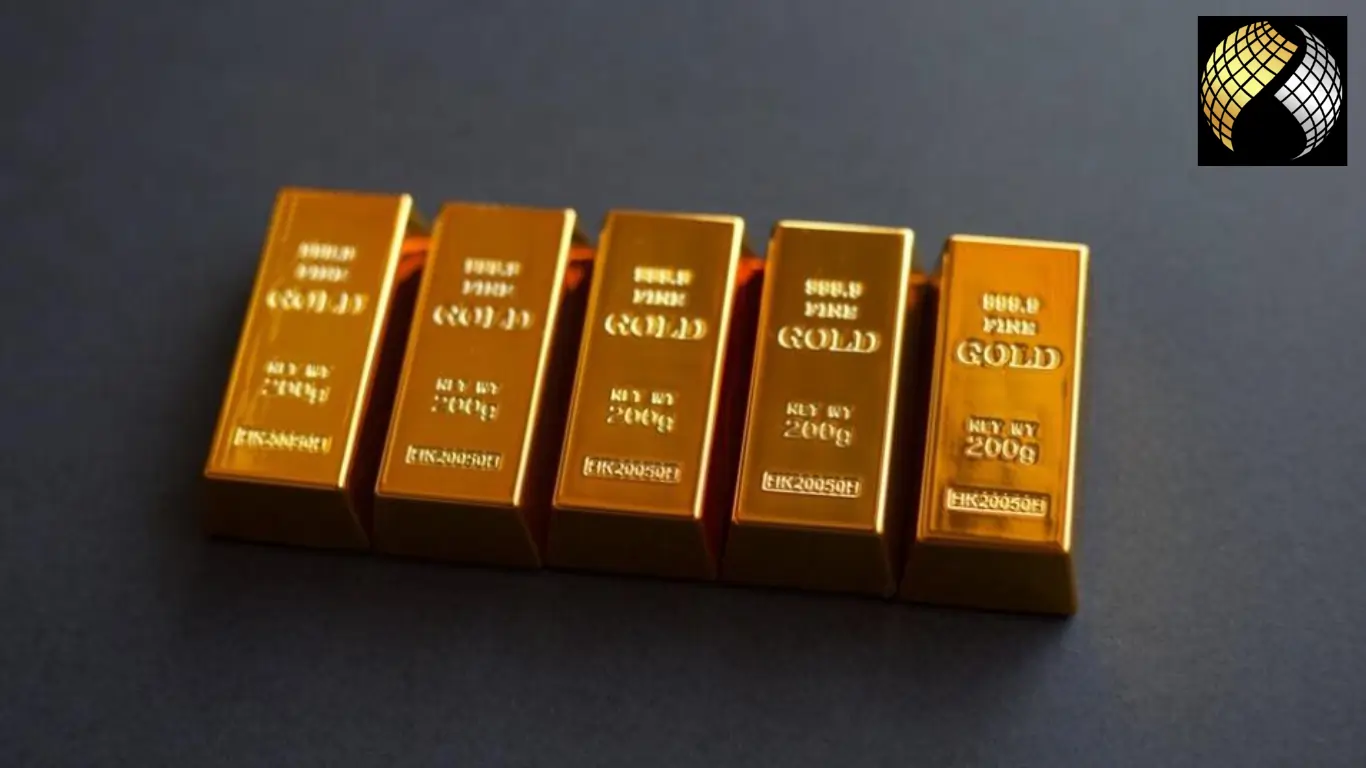
Hey there, gold enthusiasts! If you’ve been keeping an eye on the gold market, you’ve probably noticed something exciting brewing on the charts. Gold is showing off a classic inverse head-and-shoulders pattern—a setup that’s got traders buzzing with anticipation. Let’s break it down in simple terms and explore why this could mean a big move for gold prices.
Technical Analysis
Gold outlook: Israel-Iran continue to exchange blows
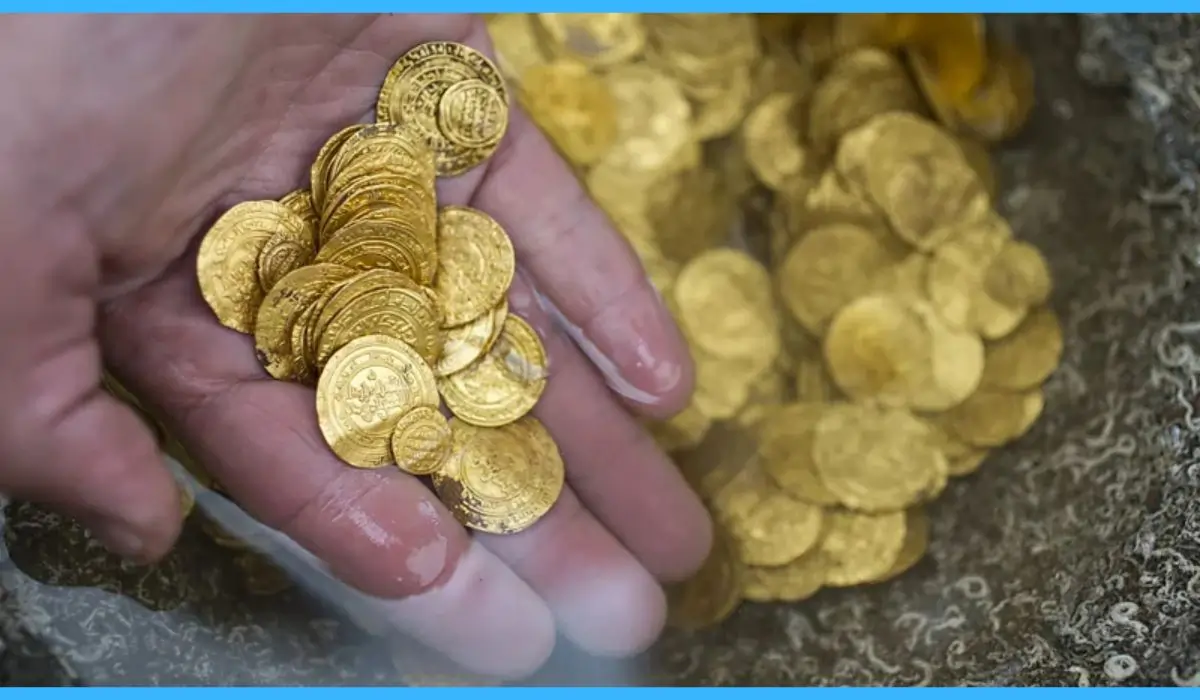
Gold prices have trended downward since the start of the week, currently hovering around $3,385 per troy ounce. This report aims to explore the fundamental factors influencing the precious metal’s price movements and conclude with a technical analysis of gold’s daily chart.
Silver Price Update: Trading Steady at $33.00

Discover the latest silver price update at $33.00, with key support and resistance levels, technical analysis, and buying/selling opportunities. Stay informed on XAG/USD trends.
Spot Gold Forecast: Bullion Looks to extend correction
![MCX Gold Target 98,500 Very Very Soon, Buy on Dips [21 April 2025]](https://goldsilverreports.com/wp-content/uploads/2020/03/gold-052904-gsr.jpg "Spot Gold Forecast: Bullion Looks to extend correction 4")
Spot Gold Forecast: The US markets will be closed due to the Labor Day holiday on Monday and as such market action is likely to remain subdued. In the early trading hours of the Asian session on Tuesday, the Caixin Services PMI data from China will be watched closely by market participants. A reading below 50 could remind investors of the slowdown in the world’s second-biggest economy and hurt gold. On the other hand, an unexpected improvement in the data could help the market mood improve, providing relief for the precious metal.
Aluminum price Jumps to Highest Since 2018 on Strong China Trade Data
Aluminum price: surged to the highest in almost three years, leading gains in base metals as Chinese trade data buoyed the outlook for demand.