
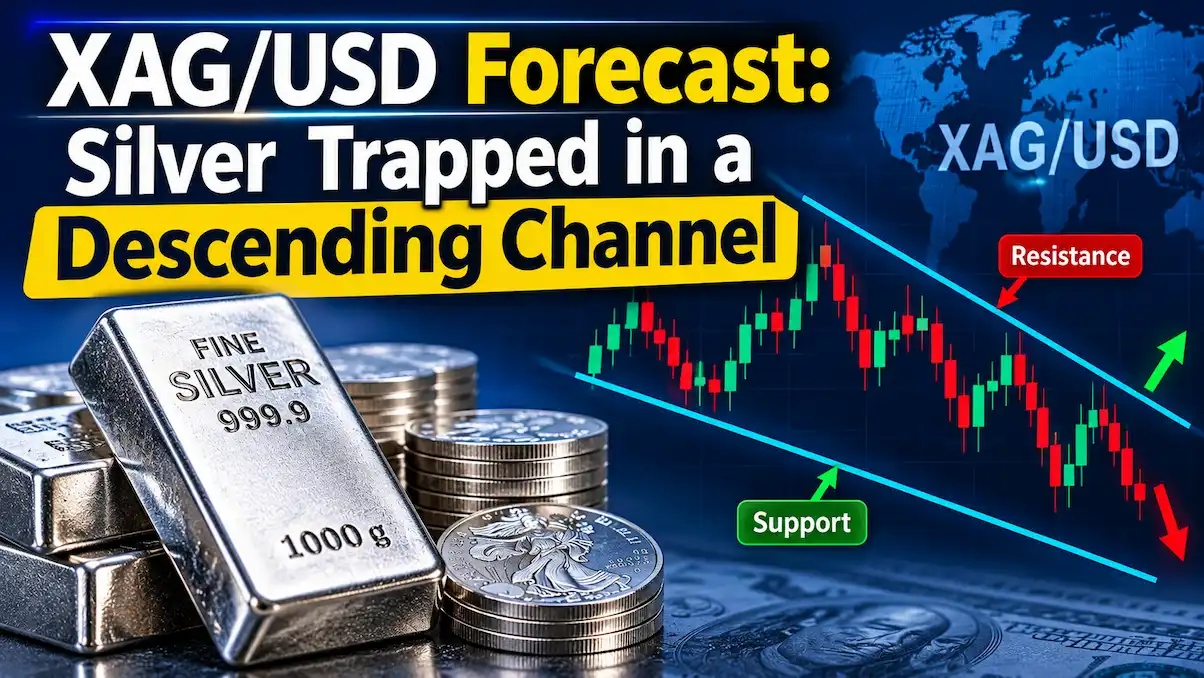
Silver Forecast: XAG/USD slides back below $50 on Friday and is on track for a weekly loss of more than 5% as traders bet on more aggressive Federal Reserve (Fed) tightening in the months ahead. At the time of writing, Silver (XAG/USD) trades around $49, just above its year-to-date low of $48.62 touched on November 3, 2026.
- Renewed Middle East Tensions Raise Global Inflation Fears
- Gold Price Surges Above $4,050 as Democrats Win Congress
- MCX Copper Tips Today: Buy Above 1342
- Copper Price Outlook Today: Bullish Trend Above 1295, Key Levels to Watch
This week’s US consumer and producer inflation reports and hawkish Fed remarks prompted traders to fully price in a rate hike in December, according to the CME FedWatch Tool. A quarter-point move is favoured, with a small chance of a half-point increase. The US Dollar Index (DXY) trades near 103.40, its highest level since April 2025, while the 10-year US Treasury yield is back above 5%, up about 30 basis points this week.
A stronger US Dollar makes Silver more expensive for buyers using other currencies, while higher Treasury yields raise the opportunity cost of holding the non-yielding metal. With buyers largely on the sidelines, the technical indicators also point to weak momentum.
Technical Analysis 15-11-2026
On the daily chart, Silver extends its slide within a well-defined downward parallel channel and is holding below all major moving averages. The 21-day simple moving average (SMA, the 100-day SMA, and the 200-day SMA all sit overhead, reinforcing a bearish near-term bias while price remains capped beneath this layered resistance.
Momentum remains weak, with the 14-day Relative Strength Index (RSI) near 33, just above oversold territory. Meanwhile, the Moving Average Convergence Divergence (MACD) remains marginally positive, but fading green histogram bars suggest that the recent recovery in momentum is losing steam.
On the topside, initial resistance emerges at the psychological $50.00 mark, followed by the upper boundary of the descending channel near $52.17 and the 21-day SMA at $53.06, forming a dense supply zone before the next hurdle at $55.00. Higher up, the 100-day SMA at $60.27 and a horizontal barrier at $62.50 precede the long-term cap from the 200-day SMA at $68.13, which anchors the broader bearish structure.
A descending channel is generally considered a bearish technical pattern
On the downside, the channel floor around $45 offers the next notable support, and a clear break beneath this level would open the way for an extension of the prevailing downtrend.
Frequently Asked Questions (FAQs)
1. What is the current trend of XAG/USD?
XAG/USD is showing a bearish technical structure as silver prices remain inside a descending channel on the daily chart.
2. What does a descending channel indicate in silver trading?
A descending channel generally indicates a downward trend, with prices forming lower highs and lower lows between two downward-sloping trendlines.
3. Is XAG/USD bullish or bearish?
The current chart structure suggests a bearish outlook. However, a breakout above the upper channel boundary could change the technical picture.
4. What happens if silver breaks below the descending channel?
A confirmed breakdown below the lower trendline could increase selling pressure and create opportunities for further downside movement.
5. Can silver prices recover from the descending channel?
Yes. If buyers gain strength and push XAG/USD above the upper trendline, silver could see a recovery and potentially develop a bullish reversal.
Disclaimer
This article is intended for educational purposes only. The views and opinions expressed are those of individual analysts or brokerage firms and do not represent the views of GoldSilverReports.com. Investors are strongly advised to consult certified financial experts before making any investment or trading decisions.