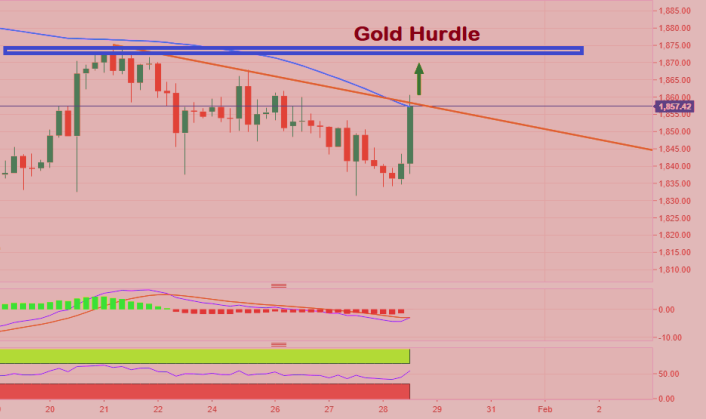
- Gold prices struggled to capitalize on its intraday positive move beyond the $1875 area.
- Neutral technical indicators on the daily chart warrant caution for bullish traders.
- The formation of an ascending triangle supports prospects for additional gains.
Is Gold Price Expected to Rise? Gold prices opened with a bullish gap on the first day of a new trading week, albeit struggled to capitalize on the move and remained capped below the $1875 resistance zone.
Meanwhile, the recent bounce from the vicinity of the $1800 mark has been along an upward-sloping trend-line. The mentioned trend-line, coupled with the $1875 horizontal resistance, constitutes the formation of an ascending triangle on hourly charts.
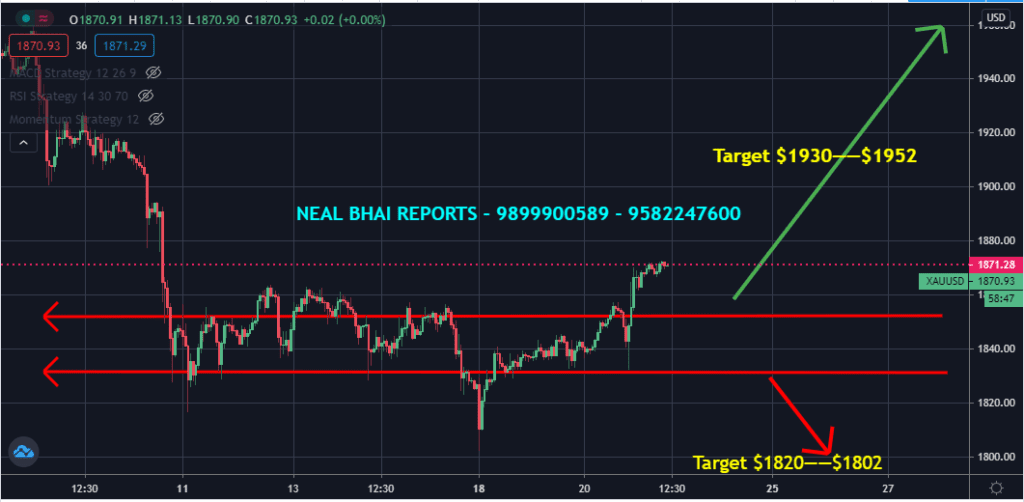
Read More : Gold Spot Open Long positions Target $1930—$1952
Ascending triangles have a bullish bias and a sustained breakthrough would mark a reversal for the gold. Hence, some follow-through buying beyond the triangle resistance should pave the way for an extension of the recent strong positive move.
Bulls might then aim to reclaim the $1900 round-figure mark before eventually pushing the precious metal to the $1922-24 supply zone. The positive momentum could further get extended towards testing the next gold major resistance near the $1960 region.
That said, technical indicators on the daily chart are yet to confirm a bullish bias and warrant some caution before positioning for any strong positive move. This further makes it prudent to wait for a move beyond the triangle resistance.
On the flip side, any meaningful pullback might continue to find decent support near the ascending trend-line, currently near the $1843-41 region. A convincing break below will negate the constructive outlook and prompt some aggressive technical selling.
The gold might then turn vulnerable to weaken below the $1830 intermediate support and slide back towards challenging the $1800 round-figure mark.
Estimated reading time: 2 minutes