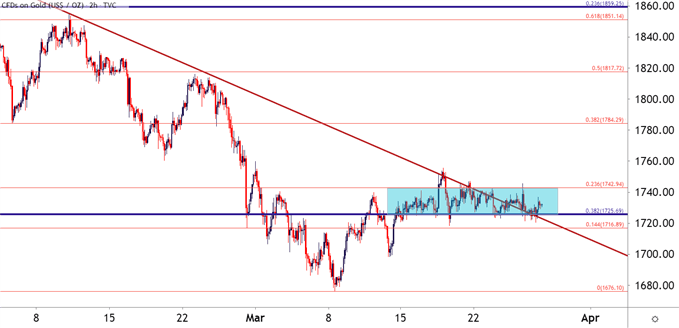
Gold Price Forecast: Q1 is not winding down in the way that many Gold bulls had imagined, myself included. For the past two weeks Gold prices have been stuck in a fairly consistent albeit relatively small trading range, spanning about 2% of Gold spot price as a couple of Fibonacci levels have helped to define this mean reversion.
Are Gold Prices Expected to Fall?
At 1725 – we have a key level as this is the 38.2% Fibonacci retracement of the 2018-2020 major move. And at 1742 we have that 23.6% retracement of the more recent move, spanning from the August high down to the March low. Collectively those prices have helped to define this recent range, but as the door nears open into Q2, the possibility of breakout remains as a number of macro items remain in unresolved states.
- Gold prices held the range this week, hosted between two Fibonacci levels.
- Next week brings the end of what’s been a painful Q1 for Gold bulls. Will Q2 bring change?
GOLD TWO-HOUR PRICE CHART

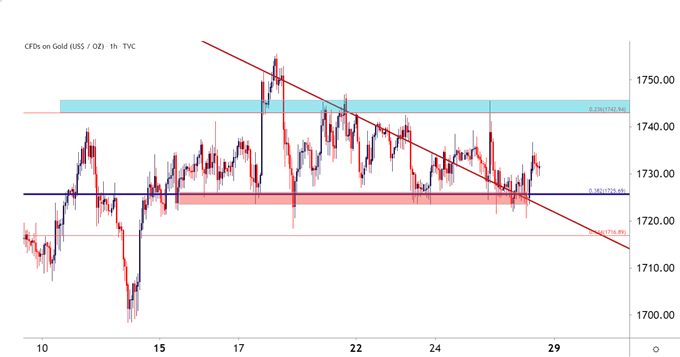
From the above chart, you’ll probably notice a trendline cutting through this week’s price action. That trendline had held price action until it first started to get tested last week. And this week saw prices grind through and eventually mount-above that trendline projection.
GOLD HOURLY PRICE CHART: TRENDLINE GRIND

To be sure, the above chart highlights considerable noise, as is often the case with mean reversion. But the longer-term chart remains compelling here, along with the pitch on that trendline, highlighting just how aggressive bears have pushed Gold prices so far in early-2021 trade.
With the end of Q1 nearing, the big question is whether they can keep pushing to the same degree – or whether something else might be going on?
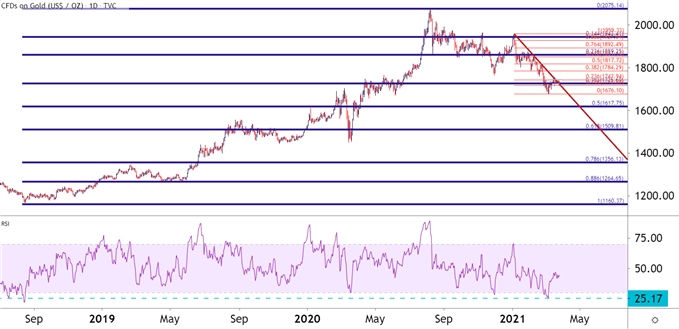
The Daily chart below highlights the longer-term cycle in Gold, with the bullish theme starting in 2h 2018. RSI moved into oversold territory in early-March, and the indicator had not been that oversold in Gold since before that bullish cycle began.
GOLD DAILY PRICE CHART

Taking an even further step back to put all of this in scope, and the bearish behavior in early 2021 might not look so threatening, especially if we consider where Gold prices had come from Extreme overbought conditions in August just before prices finally topped.
So, logically, that overbought trend was going to pull back. And, at this stage, all of that price action since the August high has been but a mere 38.2% retracement of the prior bullish move. As we discuss in our Fibonacci education, this is a standard retracement often followed for trend continuation purposes; and this could help to keep the door open for bullish scenarios in Gold as the door begins to open to Q2.
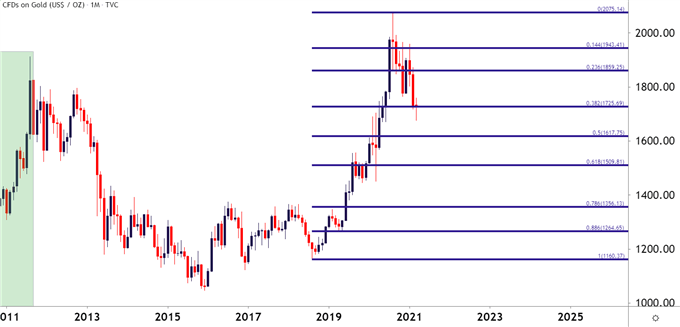
And – at this stage, the monthly bar for March is showing as a doji, often found around turns or inflection points as bulls come back to offset the bearish behavior of prior months. Now – there’s still a few days left in Q2 next week; but this combination of Fibonacci support with a completed doji make for an interesting bullish argument behind Gold prices.
GOLD PRICE MOVING FORWARD
At this point, the resurgence of the bullish theme has yet to show any signs of actually happening, which is what makes next week so important. First and foremost – will bulls protect the low and secondly, will that monthly bar close as a doji – keeping the door open for the build of a morning star reversal pattern. But, perhaps more important, how will Gold and US Treasury rates react around the Q1/Q2 shift?
For next week the forecast will be set to neutral. But the bullish side is getting more interesting, and a strong week ahead can get bulls back in the driver’s seat for topside trends.
Gold Forecast for Next Week: Neutral
GOLD MONTHLY PRICE CHART

Estimated reading time: 4 minutes
