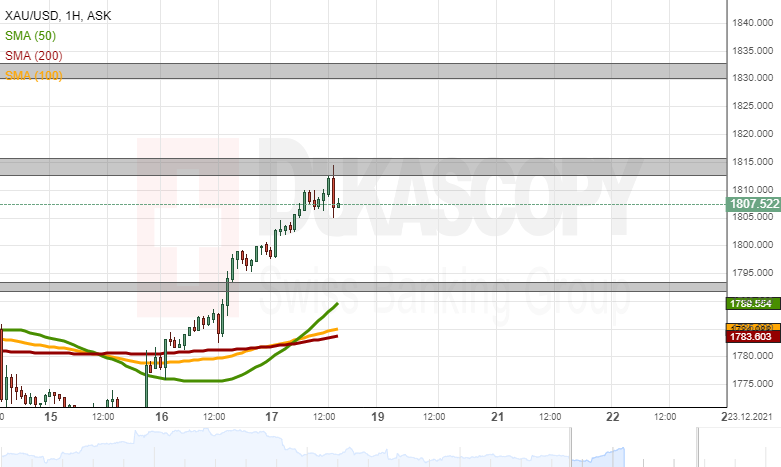
Gold Price Analysis: The price for gold has reached the 1,815.00 mark, where the late November high-level resistance zone is located at. Namely, the 1,812.50—1,815.80 zone acts as resistance.
Gold Price
If the price of the commodity bounces off the resistance zone, a potential decline could look for support in the previous resistance of the 1,800.00 mark. Below the 1,800.00 level, the previous December high zone at 1,791.80—1,793.40 might stop a price drop.
Meanwhile, a surge above the 1,812.50—1,815.80 zone might find resistance in round price levels until the metal reaches the summer high-level zone at 1,830.00—1,833.00.
Gold Eyes $1,835 As Next Target
- Gold stage a sharp U-turn after dropping toward $1,750 earlier in the week.
- Risk aversion amid heightened inflation fears boost the yellow metal.
- Next target on the upside for gold is located at $1,835.
Gold fluctuated in a relatively tight channel during the first half of the week but slumped to its weakest level in two months at $1,753 late Wednesday. The precious metal, however, managed to stage a decisive rebound and broke above $1,800 on Friday, snapping a four-week losing streak.
Gold Outlook Next week
The risk perception will continue to impact financial markets at the start of the next week in the absence of high-tier macroeconomic data releases. Gold is likely to find demand as a traditional safe haven if investors remain concerned over the potential negative impact of the Omicron variant on activity and inflation outlook.
On Wednesday, the US Bureau of Economic Analysis will release its final estimate of the third-quarter Gross Domestic Product (GDP). Investors expect the annualized GDP growth to be left unchanged at 2.1% and the market reaction is likely to be muted.
On Thursday, the Personal Consumption Expenditures (PCE) Price Index, the Fed’s preferred gauge of inflation, will be looked upon for fresh impetus. On a yearly basis, the Core PCE Price Index, which excludes volatile food and energy prices, is expected to rise to 4.5% from 4.1% in November. Ahead of the Christmas break, market participants could ignore this inflation report since they already know what the Fed’s plan to control price pressures look like.
In short, the market sentiment and technical signs should impact gold’s valuation heading into 2022.
Gold Technical Analysis
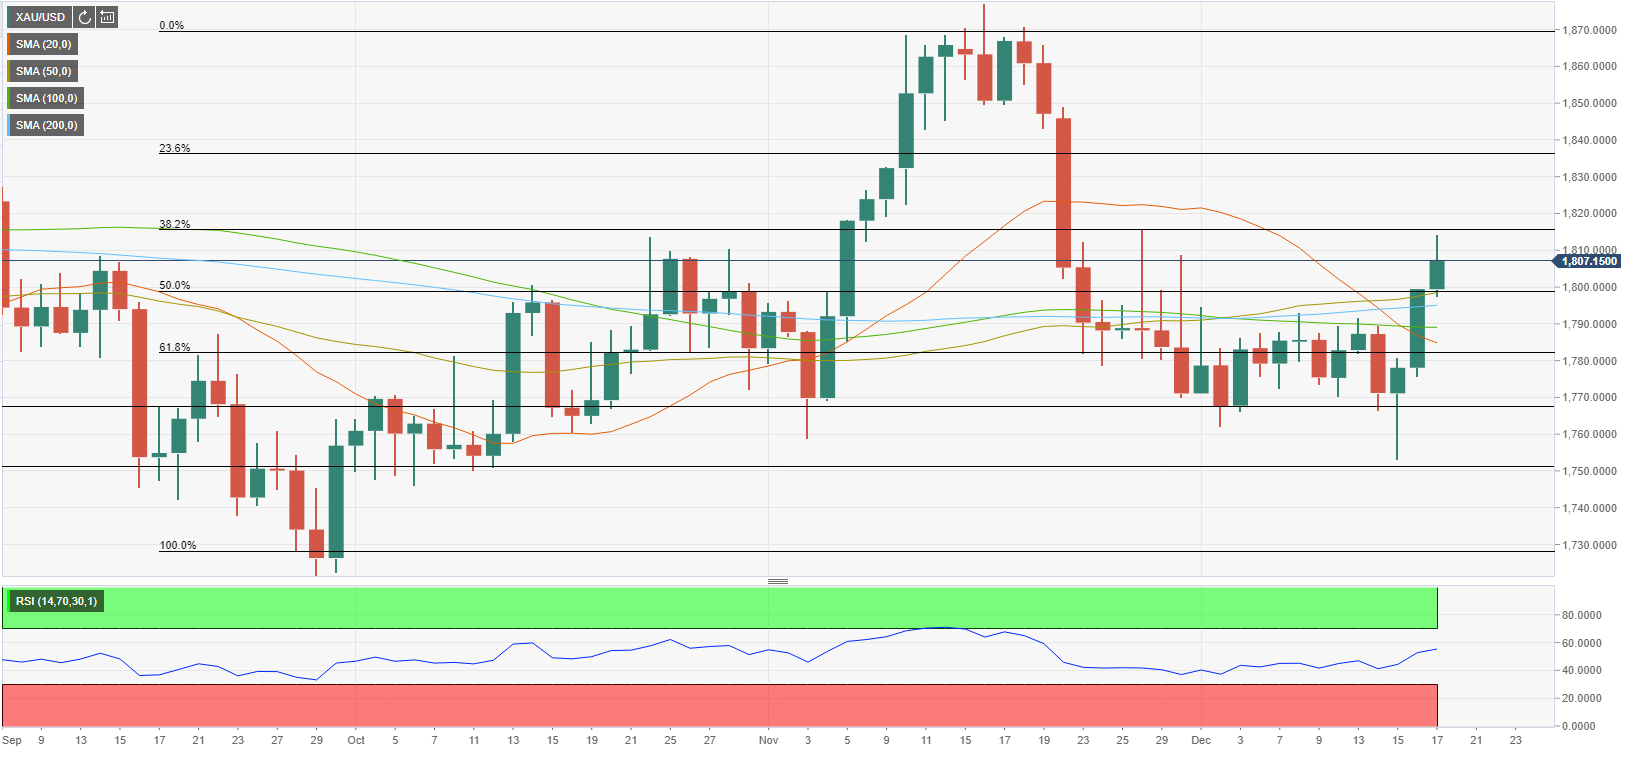
On Thursday, Gold closed above the 200-day SMA for the first time since late November and climbed to a new December high of $1,814 on Friday. The 38.2% Fibonacci retracement level of the latest uptrend seems to have formed resistance near that level. In case the pair rises above that level and confirms it as new support, it could target $1,835 (Fibonacci 23.6% retracement).
On the downside, $1,800 (psychological level, Fibonacci 50% retracement, 50-day SMA, 200-day SMA) aligns as significant support. As long as this level holds, buyers are likely to remain in control of gold’s action. In the meantime, the Relative Strength Index (RSI) indicator on the daily chart is holding above 50, confirming the view that the bullish momentum is building up.
Below $1,800, $1,790 (100-day SMA) could be seen as next support below $1,780 (Fibonacci 61.8% retracement).