Overbought markets can be complicated things: While the backdrop is less assuring for continuation, there’s usually a reason for why the market became overbought in the first place. And, those reasons can certainly continue… and continue and continue, just as we’ve seen in Gold.
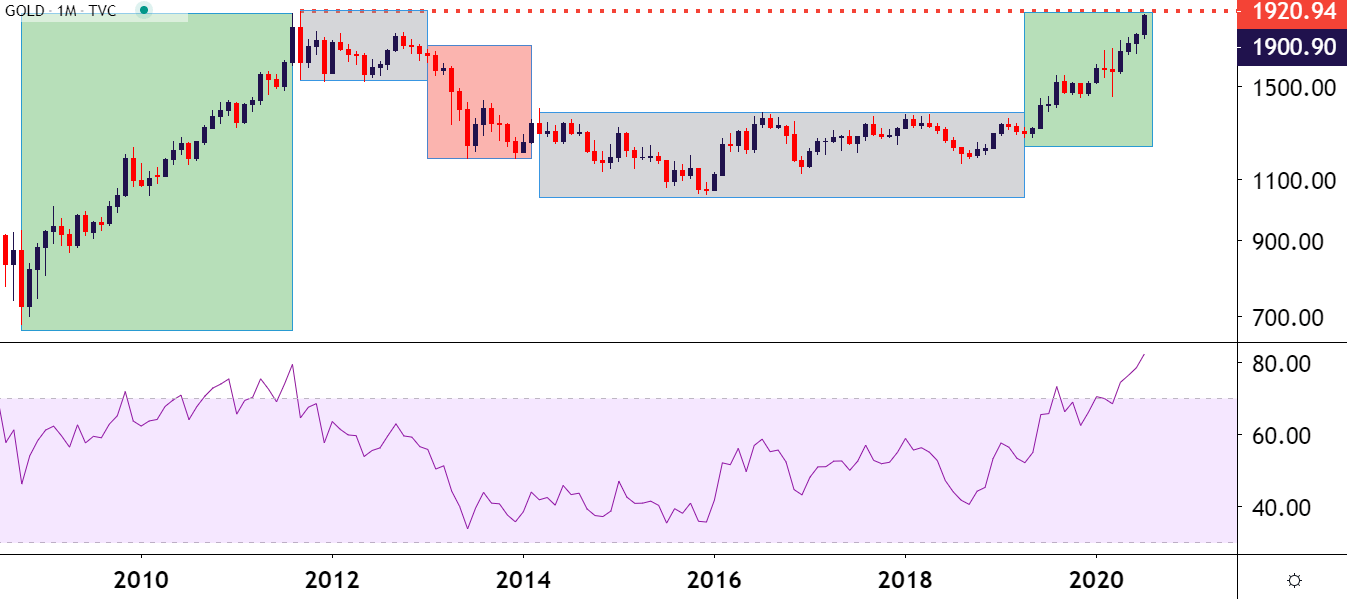
GOLD EIGHT-HOUR PRICE CHART
Now, with that being said, Gold prices haven’t been on a straight-line-higher throughout this year; even if it might seem that way. There was a patch in mid-March when the yellow metal gave up almost 15% in about a week. But support soon showed up at the same area that held the Q4 lows, after which bulls made a pronounced re-entry back into the equation and drove prices up to a fresh seven-year-high.
And then from mid-April to mid-June, prices ranged back-and-forth, save for one quick bullish flare when Jerome Powell said that there was ‘no limit’ to what the Fed could do with the liquidity programs available to them. That quick breakout turned out to be false, and prices retreated into the range to continue bouncing between support and resistance.
But that next bullish leg didn’t take long, as a few weeks later buyers showed-up to produce some higher-low support and, since then, Gold prices have been in the midst of an aggressively bullish run.
This was a big week as that move in Gold hit fever pitch: Buyers crowded the bid to extend the advance all the way up to the 1900-level, which hasn’t been traded at in Gold since 2011. This leaves but one obvious point of possible resistance ahead for Gold prices and that’s at the 1920 all-time-high that was set almost nine years ago. After that – we’re in fresh all-time-high territory and there’s literally no historical models to draw from; so there would likely be some potential for resistance at psychological levels of 1950 and again at 2000 but, this is based solely on projective given that these are both things that have literally never happened before.
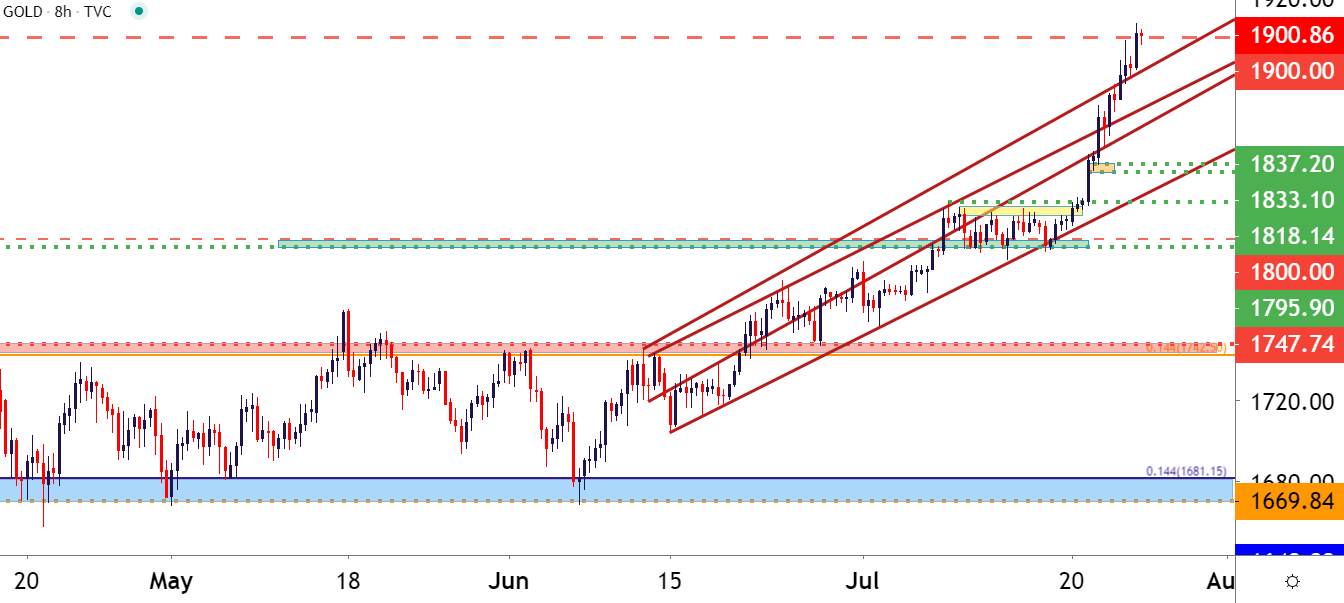
But the trend is undeniable – and at this point there’s little evidence to suggest that anything is ready to change or reverse. If we incorporate the fundamental backdrop, and zero-in on that FOMC rate decision sitting on the calendar for Wednesday – there could certainly be motive for continuation as its not likely that the Fed is going to say that they’re looking to raise rates or make policy any less accommodative anytime soon. So, despite the overbought readings on long-term Gold charts, there could be scope for continuation and a fresh all-time-high in the not-too-distant future.
GOLD MONTHLY PRICE CHART, RSI APPLIED